Game of Thrones Community Graph
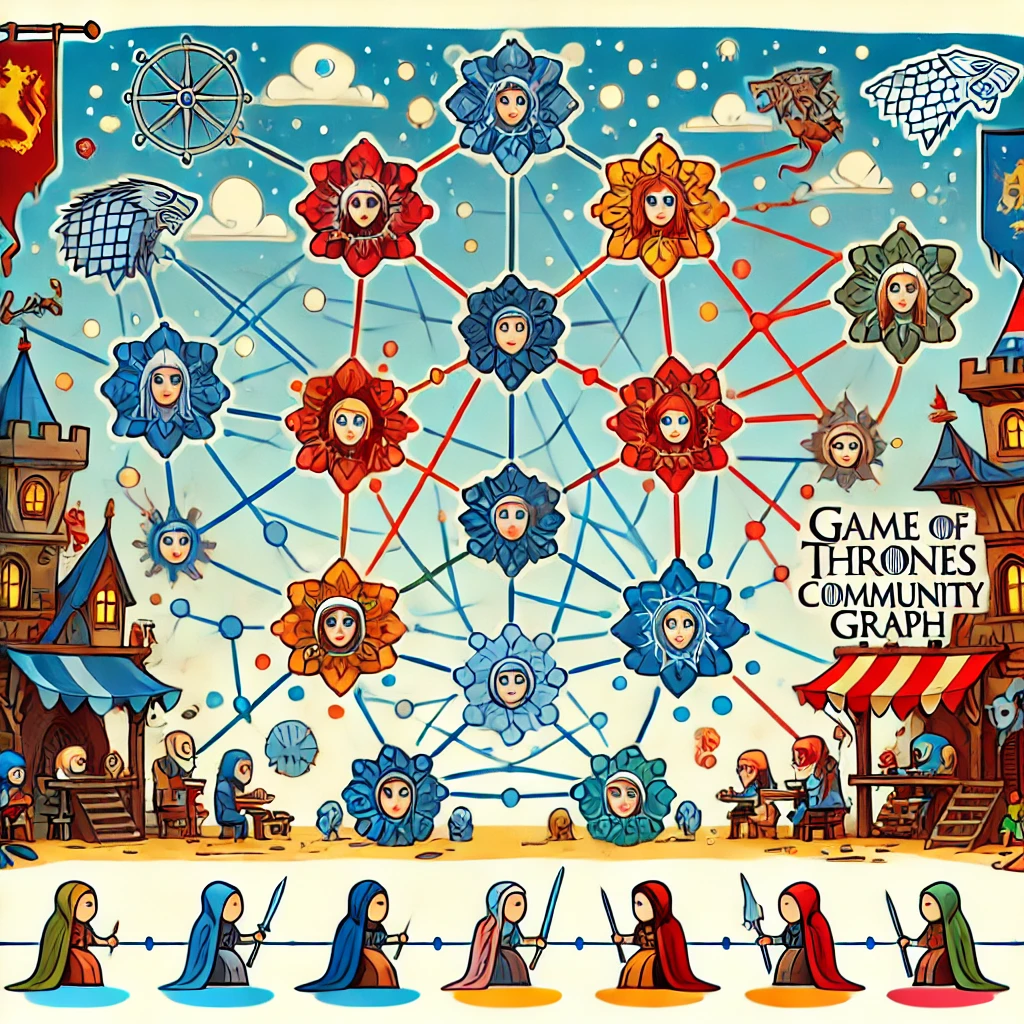
This project explores the relationships between characters in Game of Thrones by analyzing the text from the books. Using raw .txt files, the relationships are determined based on how frequently character names appear together within a small contextual window in the text.
By visualizing these connections as a graph, we can uncover the network of alliances, rivalries, and interactions that shape the world of Westeros.
🔗 Explore the Interactive Graph Here!
💻 View the GitHub Repository Here!
Finance Dashboard
This project is a minimalist finance dashboard built using Dash, designed to provide a clear overview of spending habits. The dashboard includes two key visualizations:
- A bar chart displaying spending trends over three years.
- A pie chart breaking down spending by category.
Using dummy data, the dashboard demonstrates how financial data can be visualized and analyzed effectively. It is deployed using Render, making it accessible online for real-time interaction.
📊 Explore the Live Dashboard Here!
💻 View the GitHub Repository Here!
Apple Stock Prediction
This project explores the feasibility of predicting Apple stock prices primarily using Long Short-Term Memory (LSTM) networks, a deep-learning approach for time-series data.
By analyzing historical stock data, the model aimed to forecast market trends. While LSTM outperformed other models, achieving a 52.3% trend prediction accuracy, the results highlight the challenges of using AI for stock forecasting.
Although not yet a reliable trading tool, this project provides insights into the potential and limitations of machine learning in finance—offering a foundation for future improvements.
📊 Read the Documentation Here!
💻 View the GitHub Repository Here!